
Unit 6 BTEC HND Business Decision Making Assignment

| Module | Unit 6 Business Decision Making |
| Programme Name | BTEC Level 5 HN Diploma in Business (QCF) |
| Unit code | D/601/0578 |
Introduction
In this report, the discussion will be conducted on various types of data, methodology and data collection methods from different sources that will be arranged as per the system for attaining helpful information (Black 2011). This information will help in taking better decisions. Understanding information is very significant in taking effective business decisions. This report also aims at supporting the management to understand the status of the industry. It would also help in understanding how the data can be interpreted so as to derive some fruitful information from it.
Task 1: Variety of sources for the collection of data, both primary and secondary
1.1 Plan for collecting primary and secondary data for the project
Data are details, statistics, charts, photographs, images, etc. Data types are of two types such as qualitative and quantitative data. According to Black (2011), quantitative data implies where data is collected through questionnaire, survey, and trails, etc and all these collected data are in the format of number (Black 2011). It is significant to gather both data types in order to attain the output. Primary data will be gathered through survey method. Primary and secondary data sources will be considered for the purpose of determining the student base and for exploring the lying opportunities for Surrey new school.
For collecting secondary data, the yearly report related to the educational department and Municipal Corporation will be made used along with reports of NGOs, magazines, newspapers. The use of secondary sources will be supportive in exploring the number of schools located in Surrey, their performance, and competition level that is crucial in understanding opportunities for opening new schools.
Simultaneously, in this report market survey will be conducted with the respondents from Surrey local communities. There are different primary sources like survey, focus group, interview and observation, but in this research survey method will be used, as it’s the most reliable evidence in understanding performance of schools and student base through gathering views from local people (Black 2011). Along with this, it will be helpful in checking that whether opening new schools in Surrey will be a viable option for Excellent Education or not.
1.2 Survey methodology and sampling frame used
A. Survey methodologies and strengths and weaknesses.
Questionnaire Survey
Questionnaire survey includes both open-ended and close-ended questionnaire, which is developed for identifying the respondent’s answers. The method of questionnaire survey is effective for conducting market research in the case of close-ended questions. It is due to the reason that there is a need for fewer efforts and time for completing it (Castellan 2010). There exists a high possibility for incomplete answers given by the respondents, which might raise the survey budget as again survey questions will be asked.
Interview
Another methodology for survey is face to face interview with selected respondents. Through this method, personal communication could be conducted with the researchers, which might not be effective in gathering relevant perception, but simultaneously it is helpful in asking follow-up questions as it’s crucial in obtaining valid information (Castellan 2010). This method is quite a time taking a huge amount of time is taken for making an appointment with respondents.
Cross-Sectional Survey
In this survey methodology, views are gathered from the participants in a short time, and this methodology is also supportive in conducting a survey through applying the mode of data gathering such as questionnaire and interview (Castellan 2010).
Online Survey
Online survey method is the popular method in the era of the internet, as in this method, a survey is conducted through the internet or through sending e-mails to respondents. No personal contact needs to be made in this method with respondents (Castellan 2010).
In this research, a survey through the questionnaire will be conducted as it’s the relevant method in Excellent School Education Plc.
B. Techniques of Sampling
Random Sampling
Random sampling is one of the easiest methods for choosing the respondents through the targeted population. This method permits that every member of the targeted population should be provided with an equal chance of getting selected for the market survey that is even effective and tries to avoid the issues of biasness (Davis and Pecar 2013). But the random sampling doesn’t work in the case of huge population size due to the need for a lot of time for creating the list for individuals. Along with this, it also creates an influence on the quality of survey outcomes due to the existing possibilities of choosing the person who has no knowledge about the issues.
Judgement Sampling
Judgement sampling is the non-probability method, which chooses the sample according to the judgement. This method is effective in improving the quality and result validity (Davis and Pecar 2013). But at the same time, this method needs skills and qualities for selecting population.
Convenience sampling
This method is mainly selected for those who have an interest in taking part in a survey. This method incurs less cost, but it might cause biasness in choosing the participants.
Cluster sampling
This method includes the selection of respondents by applying simple random sampling (Davis and Pecar 2013). This method is better than stratified sampling as it is effective in getting appropriate respondents for the survey, but at the same time, it is less precise than random sampling.
In this research, a random sampling method will be selected as it’s helpful for parents and couples living in Surrey local communities.
Sampling techniques strength and weakness
Strength– in selecting the appropriate method of sampling, little knowledge about the population is needed. In the case of systematic sampling, subjects are not numbered.
Weakness– in case of simple random sampling requires numbering the components existing in the population set. The cluster sampling requires that each component of the population should be assigned to the single cluster (Diggines and Wiid 2010).
1.3 Questionnaire to be used to collect data for the project from prospective parents.
A survey questionnaire for conducting market research for prospective parents is given below:
I. Personal details
A. What’s your Gender?
Male
Female
B. How many children’s do you have?
1
2
3
More than 3
C. What’s your income level?
£8,000-£12,000
£12,001-£20,000
£20,001-£35,000
More than £35,001
II: Key Questions
Question 1: Do you have any knowledge about the Excellent School Education?
Yes
No
Can’t Say
Question 2: Do you think that secondary schools are enough in Surrey?
Yes
No
Can’t Say
Question 3: Are you satisfied with the present school system of children?
Satisfied
Highly satisfied
Moderate
Dissatisfied
Highly dissatisfied
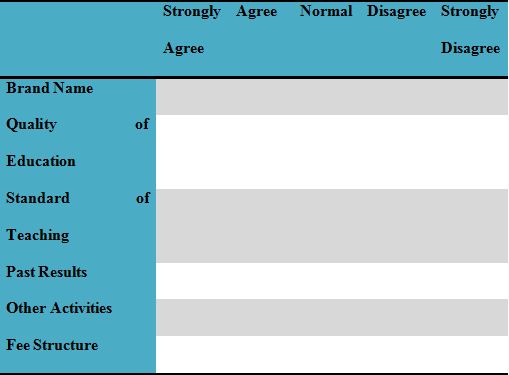
II. Factors considered in choosing a school
Below table depicts the relevant rate level that is required to select a school
Task 2: Range of techniques to analyze data effectively for business purposes
2.1 Information for decision making by summarizing data using representative values
The collected data is presented in tabular format, which includes a score attained by the students in their internal exams. There were 50 students and their subject scores are mentioned below:
| Students Number | Score |
| 1 | 20 |
| 2 | 32 |
| 3 | 64 |
| 4 | 45 |
| 5 | 21 |
| 6 | 42 |
| 7 | 46 |
| 8 | 39 |
| 9 | 52 |
| 10 | 48 |
| 11 | 72 |
| 12 | 43 |
| 13 | 30 |
| 14 | 58 |
| 15 | 29 |
| 16 | 37 |
| 17 | 36 |
| 18 | 41 |
| 19 | 55 |
| 20 | 68 |
| 21 | 60 |
| 22 | 46 |
| 23 | 39 |
| 24 | 56 |
| 25 | 68 |
| 26 | 30 |
| 27 | 43 |
| 28 | 48 |
| 29 | 32 |
| 30 | 40 |
| 31 | 41 |
| 32 | 45 |
| 33 | 58 |
| 34 | 39 |
| 35 | 59 |
| 36 | 70 |
| 37 | 33 |
| 38 | 44 |
| 39 | 46 |
| 40 | 48 |
| 41 | 37 |
| 42 | 62 |
| 43 | 75 |
| 44 | 40 |
| 45 | 54 |
| 46 | 45 |
| 47 | 48 |
| 48 | 57 |
| 49 | 40 |
| 50 | 56 |
Grouped Data:
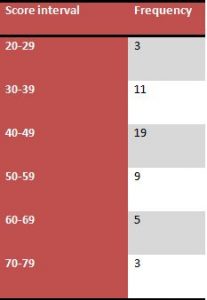
2.2 Results analyzed to draw valid conclusions in a business context
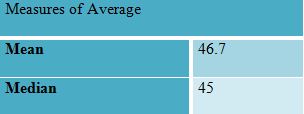
Mean, median and mode are referred to as a measure of average that is supportive in determining the student average performance in internal exams (Joh 2003). Through the support of an excel spreadsheet, the mean and median values are determined on the given score of students.
Mean
Formula (∑x_i )/n
Mean= Sum of total observation/total number of observation
Mean= (20+32+64+45…….48+57+40+56)/50
Mean=2337/50
Mean=46.7
Median= ((n+1)/2)^th term
If the number of terms are odd; ((n/2)^th term + (n/2+ 1)term)/2 for even number
Median = [(50/2) term + (50/2+1) term]/2
Median = [25th Term+26th Term]/2
Median =45
Strengths and weaknesses of measures of average:
| Mean | Median | Mode | |
| Strengths |
|
|
|
| Weaknesses |
|
|
|
2.3 Measures of dispersion to inform a given business scenario
Representative measures indicate about the location of the data and 2 sets of data could have meant, median and mode (Joh 2003). For explaining the difference, descriptive measures are used that indicate the variation and are also known as measures of dispersion. It includes:
Range– it’s referred to as the difference among the highest and lowest value. This method is easy to calculate, but it only considers the small and large values and ignores other values.
Quartile range– it’s the difference among the 3rd and 1st quartile. It doesn’t include all values within the data set; therefore, it’s not the preferred indicator.
Variance and standard deviation– Variance measures the distance of an observation from mean value; Standard deviation is considered as the square root of the variance (Kumar 2010). Both these measures offer helpful information for making the decision and for making the comparison.
There are different statistical measures of dispersion such as standard deviation, range and variance that are supportive in determining how student’s performance has deviated within the class in reference to marks.
Variance formula (∑(x-x ̅ )^2 )/((n-1) )
Standard deviation= Square root of the variance.
In Standard deviation, s is the variance sq root
Variance= (715.02+663.06+…+638.06+798.62)/50
= 8061.52/50
=161.23
Standard Deviation= Square root of (161.23)
= 12.75
2.4 Quartiles, percentiles and the correlation coefficient used to draw useful conclusions in a business context
Quartile tries to present the 2 quarters distribution of middle value. In this lower value of quartile is between 1st and 2nd quarter. The upper quartile is between 3rd and 4th quarter, and the middle quarter is known a median. Percentile is the value that divides the sample data of 100and includes observation in equal values (Kumar 2010). Coefficient correlation measures the data set as the mean proportion. It’s the sample ratio for standard deviation and is explained as a percentage. All three measures divide the frequency distribution into different parts (Kumar 2010). According to 50% of staff, their expected salary is above £40000 and the other 50% of the staff has less than £40000.
Results Interpretation
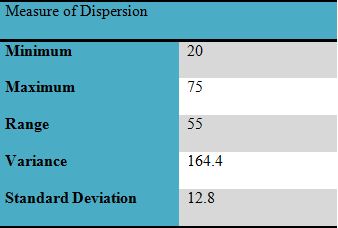
The measure of Dispersion:
It can be determined from the results that the student average mark is 46.7. it depicts that most of the students have obtained less than 50% in their exams, and the performance is satisfactory. The median value is 45 that implies a similar outcome about student’s performance. It is also determined that the low score is 20 and the highest score is 75. It is also interpreted that variance and standard deviation values, which mark students score is deviated in class and depicts the difference in student’s performance.
Quartiles
Q_(1 )= (n+1)/4
Q_(3 )= 3((n+1)/4)
The value of 1st, 2nd and 3rd quartiles:
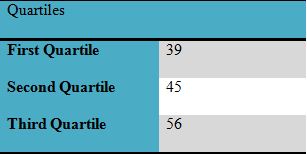
The 1st, 2nd and 3rd quartiles are 39, 45, and 56 respectively. It is interpreted that students score in the exam is deviated from one another due to a difference in students performance.
Percentiles
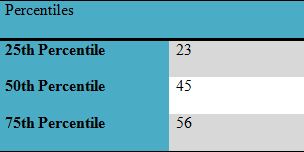
The above table shows the difference in student’s performance in the context of marks obtained in internal exams.
Correlation Coefficient
It measures the relationship that is supportive in exploring association among 2 variables.
Correlation coefficient formula:
The value of correlation coefficient is 0.24
It is interpreted from results that there is week relation among 2 variables and there is no effect on the sequence of students in exam scores.
Performance Comparison
For making students performance comparison as per the subject score, the hypothetical score is assumed for 50 students. The performance comparison will support in measuring average, percentiles, quartile, measures of dispersion, and correlation coefficient.
| Score in Subject 1 | Score in Subject 2 | |
| Measures of Average | ||
| Mean | 46.7 | 43.8 |
| Median | 45 | 43.5 |
| Measure of Dispersion | ||
| Minimum | 20 | 16 |
| Maximum | 75 | 78 |
| Range | 55 | 62 |
| Variance | 164.4 | 328.4 |
| Standard Deviation | 12.8 | 18.1 |
| Quartiles | ||
| First Quartile | 39 | 26.25 |
| Second Quartile | 45 | 43.5 |
| Third Quartile | 56 | 57.25 |
| Percentiles | ||
| 25th Percentile | 23 | 46.25 |
| 50th Percentile | 45 | 43.5 |
| 75th Percentile | 56 | 57.25 |
| Correlation Coefficient | ||
| Correlation Coefficient | 0.24 | 0.05 |
It is noted from the results that students’ average marks in class are more as compared to other subjects. It can be measured that the correlation coefficient value is high in subject 1 as compared to other subjects, which shows strong relations than other subjects. It can be concluded that student performance in exams is not so good.
Task 3: Information in appropriate formats for decision making in an organizational context
3.1 Graphs using spreadsheets and draw valid conclusions based on the information derived
Tables are good as it presents huge information, but it’s challenging to explore the patterns. Therefore, graphs and charts are prepared for presenting the data. Graphical methods can be bar charts, line charts, scatter graph, and pie charts.
Line Chart
This graph makes use of line instead of a bar or either circle. It can be drawn easily and could analyse the trends and even make predictions.
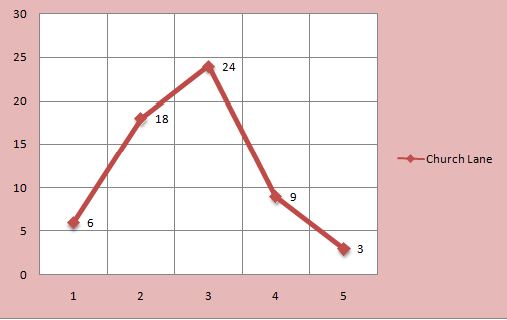
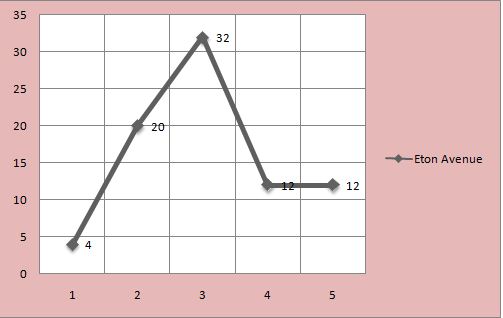
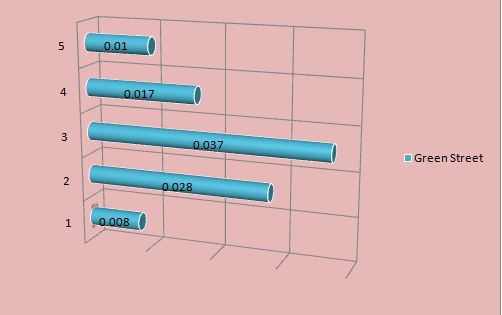
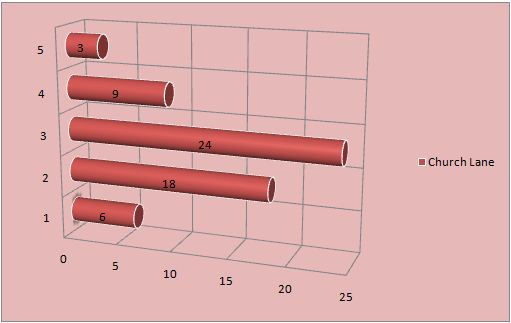
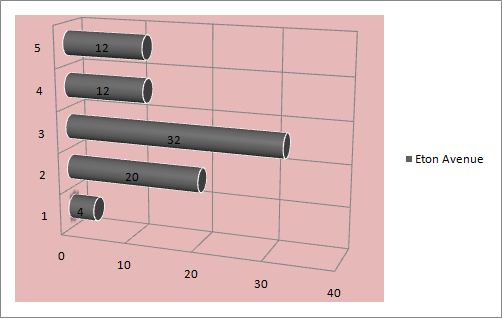
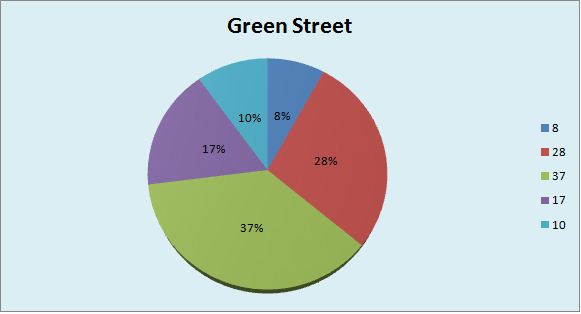
Bar Chart- it depicts the number of observation in various categories, and every category presents the separate bar and bar length is mainly proportionate to a number of observation (Luton 2010).
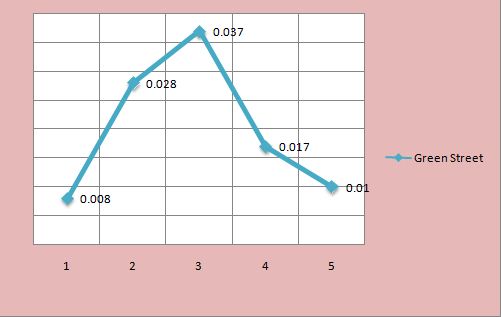
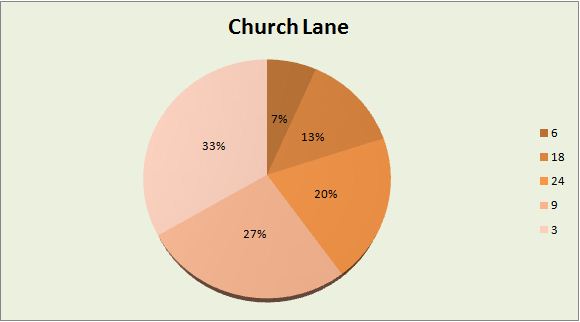
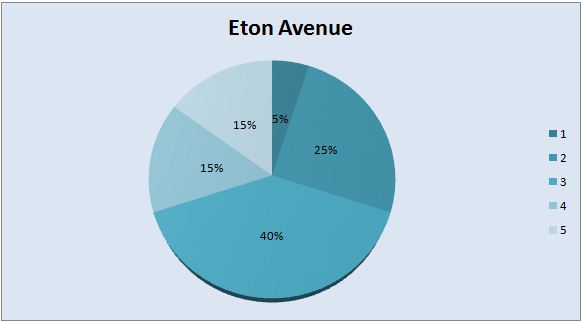
Below is the graphical presentation of data that includes a number of bedrooms and houses in 3 streets of a city.
Pie chart: In the pie chart, every slice presents a single category. These graphs are simple but show only fewer data.
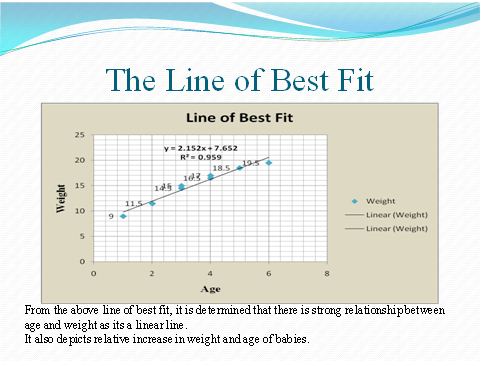
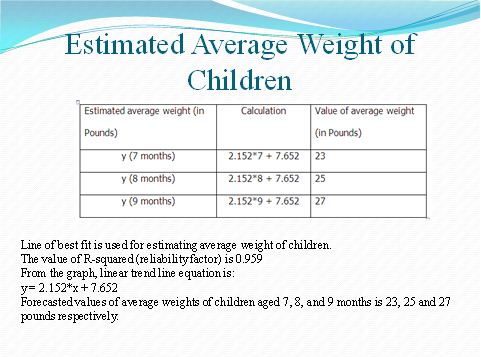
3.2 Tend lines in spreadsheet graphs to assist in forecasting for specified business information
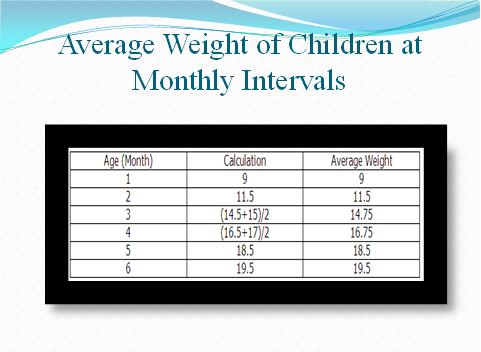
Scatter diagram is drawn by the use of 2 variables, and in this commission is drawn against the year (Spann 2014). The commission is the plot at y-axis and year is at x-axis. This diagram presents a relationship of 2 variables whether they are correlated positively or either negatively. In this case, this diagram is helpful in checking whether there is an increase in children’s age that effect on weight or not.
| Age | 1 | 2 | 3 | 3 | 4 | 4 | 5 | 6 |
| Weight | 9 | 11.5 | 14.5 | 15 | 16.5 | 17 | 18.5 | 19.5 |
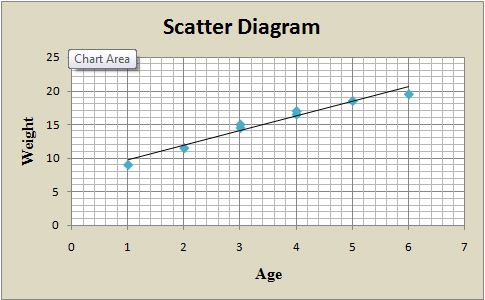
The graph shows the positive relationship between weight and age of babies.
3.3 Business presentation using suitable software and techniques to disseminate information effectively


Task 4: Software-generated information to make decisions in an organization
4.1 Information processing tools
Information processing tools are known as a processor and these are tangible and non-tangible equipment, which are made use for arranging the data like serves, ATM’s, database, methodologies, computers, internet, websites, computers, and networks. In the company, budgets, cash flow statement, project plan as well as investment appraisal are termed as information tools (Spann 2014). In capital budgeting, there are various methods of investment appraisal, which are helpful in checking the viability of capital investment as well as the financial feasibility of the project.
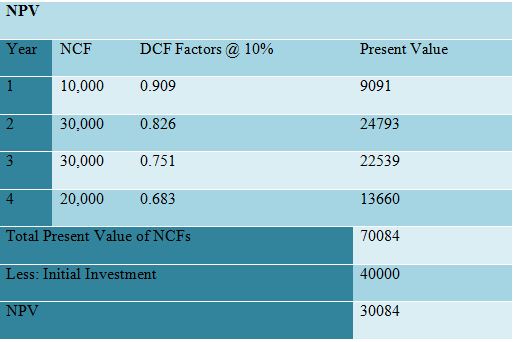
Net Present Value (NPV)
NPV is referred as the technique of discounted cash flow, in which all the expected outflow and inflow of cash is discounted at the company’s cost of capital for the purpose of determining the current value (Spann 2014). NPV is referred to as variation among the current value of the expected flow of net cash at the certain cost of capital for a certain duration. This method considers the time value of money, investment project lifeline, and financing cost for exploring the best project in the context of profitability (Spann 2014).
Internal Rate of Return (IRR)
IRR is a technique for discounted cash flow as it determines the expected investment rate of return. This method relies upon the cost of capital, value for money and life of the project for assessing the investment viability (Vona 2012). IRR method is effective in understanding the expected investment rate of returns for assessing the capital investment profitability in the project.
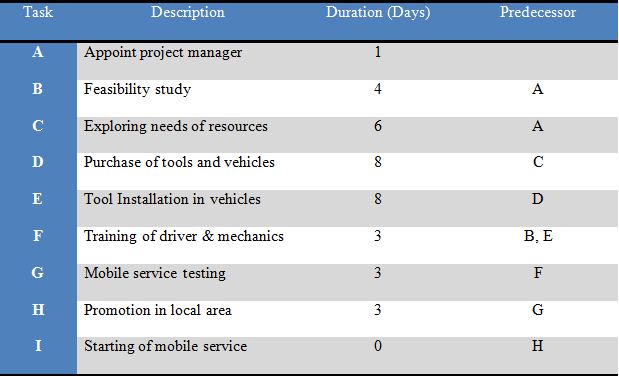
4.2 Project plan for an activity and determine the critical path.
This section includes the plans for helping the functions of mobile service projects, it includes:
- Product quality assurance
- Validation and verification of plan
- Operational and product support functions
- Budget, work packages and schedules
The budget of the mobile service project= £40,000
Duration of the project= 40 days
Project Network
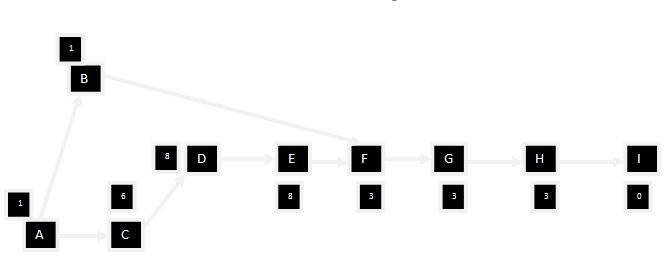
Critical path
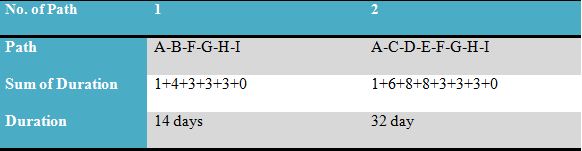
The table shows that in path 2, the duration of project completion is high as compared to path 1. It shows the projects critical path that is, A-C-D-E-F-G-H-I
4.3 Financial tools for decision making
Speedy Filters plc deals in car repairing and maintenance services. Presently, the firm is planning to start its new mobile service business, in which they will also offer the home delivery facility. The estimated initial cost will be £40,000 for purchasing 4 tools and vehicles. The technique of appraisal for this project is given below:
NPV
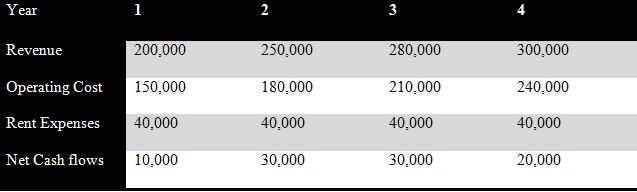
Calculation of NPV:
NPV permits to have a comparison for potential projects according to the cost of financing that is effective in determining economic option.
IRR
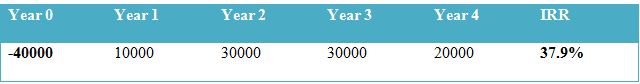
The project NPV value is £30,084, and value of IRR is 37.9%. it is estimated that through value position of NPV there are some important prospects for the project in order to enhance the business profitability. Therefore, management should adopt a better option for starting their mobile service project.
Conclusion
In business decision making, various sources of gathering the data are used and the different business cost is analyzed and presented. It also applies a wide range of techniques for understanding data. Through using various graphs valid conclusion shows that is based on the data and even lead towards preparing information report.
References
Black, K. 2011. Business Statistics: For Contemporary Decision Making. USA: John Wiley & Sons.
Castellan, C.M. 2010. Quantitative and Qualitative Research: A View for Clarity. International Journal of Education, 2(2), pp. 1-14.
Davis, G. and Pecar, B. 2013. Business Statistics Using Excel. London: OUP Oxford.
Diggines, C. and Wiid, J. 2010. Marketing Research. South Africa: Juta and Company Ltd.
Joh, S. W. 2003. Corporate governance and firm profitability: evidence from Korea before the economic crisis. Journal of Financial Economics, 68(2), pp. 287-322.
Kumar, R. 2010. Research Methodology: A Step-by-Step Guide for Beginners. (3rdedn). UK: SAGE Publications Ltd.
Luton, L.S. 2010. Qualitative Research Approaches for Public Administration. New York: M.E. Sharpe.
Spann, D.D. 2014. Fraud Analytics: Strategies and Methods for Detection and Prevention. USA: John Wiley & Sons.
Vona, L.W. 2012.Fraud Risk Assessment: Building a Fraud Audit Program. Canada: John Wiley & Sons.